
The bar chart gives information about the average weekly spending for families in a particular country in the
years
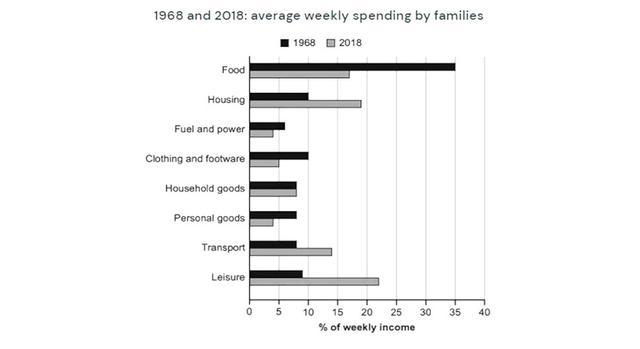
1968 and 2018.
Use synonyms
Overall
, the vast majority of family expenditure was spent on food in 1968, though the statistics declined in 2018. Linking Words
However
, the inverse was true for housing, transport, and leisure, with only household goods remaining constant over the Linking Words
years
.
A significantly larger proportion of weekly income went on food in 1968, at 35% which was exactly twice as larger than the figure after five decades. A reverse pattern was seen in the spending on leisure, housing, and transport, showing upward trends from nearly 10% in 1968. Use synonyms
However
, expenditure on recreational activities witnessed the most significant increase among the three in 2018, reaching 23%.
In marked contrast, other remaining categories either plateaued or declined. In both Linking Words
years
, household goods represented an insignificant of &% of the budget, Use synonyms
whereas
the others all decreased. Among them, the gap in clothing and footwear between the two Linking Words
years
was the most noticeable, which decreased by half, from 10%.Use synonyms