
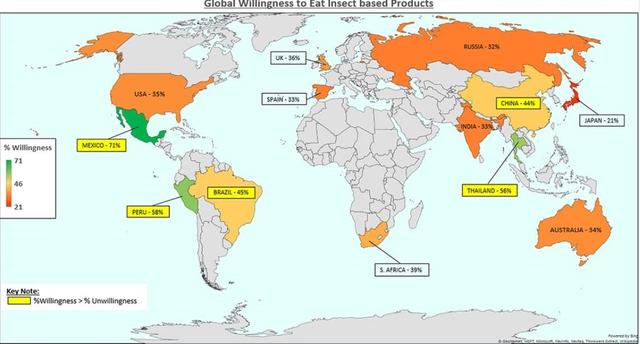
The figure illustrates the international acceptance to consume items from insects and the new price for special
food
provided on e-commerce. Use synonyms
Overall
, from the data given, the unwillingness in some countries is higher than the willingness. The biggest number of citizens who accept insects in their Linking Words
food
products are Mexicans.
In the American continent, the highest percentage of willingness is in Mexico at 71% and it is twice of the USA. Use synonyms
While
the population in Peru want to consume insect-based Linking Words
food
at 58% followed by Brazil at 45%. Folks in Africa only 39% try to eat that item. British is the most consumed of insect products at 36% followed by Rusian (32%) and Spanish (33%). Use synonyms
Moreover
, people in Asia who use insect products as the one for their Linking Words
food
intake are Thai people at 56%, and the Japanese consume less than half of them. Insect product consumption in Australia, only 34% is eaten by Australians.Use synonyms