
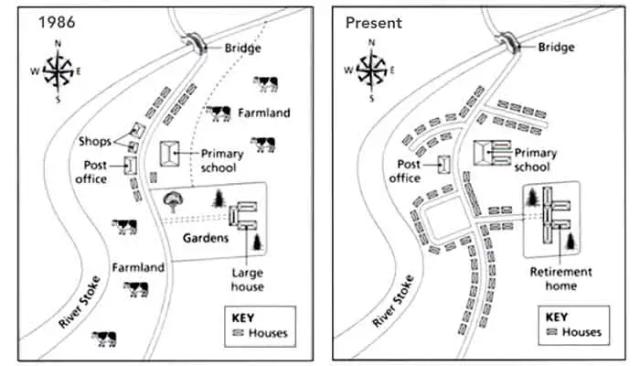
The map given shows a particular place how it was in 1986 and 2023.
Overall
, we can see a large decrease in farmlands and gardens and a huge increase in Linking Words
houses
from 1986 to 2023, Use synonyms
also
the area is blessed with a river on the west side where a bridge connects to the other side of the river is found on the north.
In terms of Linking Words
houses
, 10 small Use synonyms
houses
and a large house were present in 1986 but in 2023 the agricultural area got reduced the most by enlarging the number of Use synonyms
houses
in the area. Even shops disappeared gradually after 1986.
Use synonyms
Secondly
, the difference is the expansion of the primary school and the conversion of the large residence to a retirement home shrinking from 1986 to 2023.
Linking Words
Finally
, the main concern is the significant shrink of farming land to zero percentage which lies on the northeast of the map Linking Words
as well as
on the south right of the river.Linking Words