
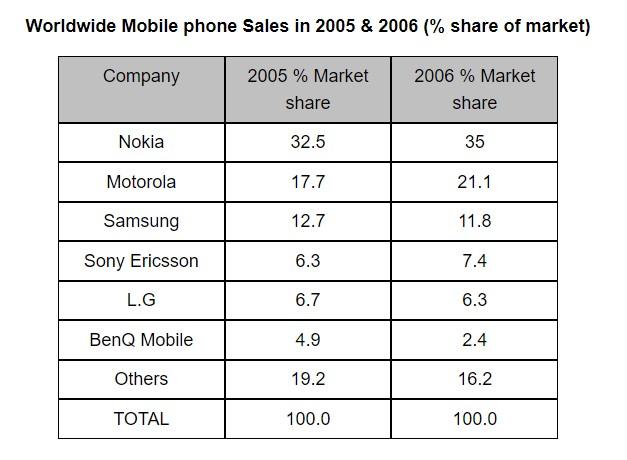
The table provides information about how many mobile phone companies were shared in the global market annually from 2005 to 2006.
In general, what stands out from the graph is that Nokia was the highest mobile phone sales throughout the given period. Another interesting point is that over half of the total percentage of the personal-phone brand witnessed an increasing trend in the global market.
In detail, starting at 32.5%
percent
in 2005, the proportion of Nokia rose slightly to 35% in the following 1 year. Change the spelling
per cent
Similarly
, the percentage of sales in Motorola generated Linking Words
17.7
% in the initial year, and it continued to incline gradually to 21.1% in 2006. Add a missing verb
was 17.7
Additionally
, the number of Sony Ericsson saw a slight climb by 1.1% annually.
Turning to other brand sales, there was a significant drop in a one-year period from just below a fifth to 16.2%. Linking Words
Then
, Samsung experienced a slow decrease from 12.7% to 11.8%. LG saw a slow drop with just below 1% Linking Words
while
BenQ Mobile underwent a considerable fall by almost a half.Linking Words