
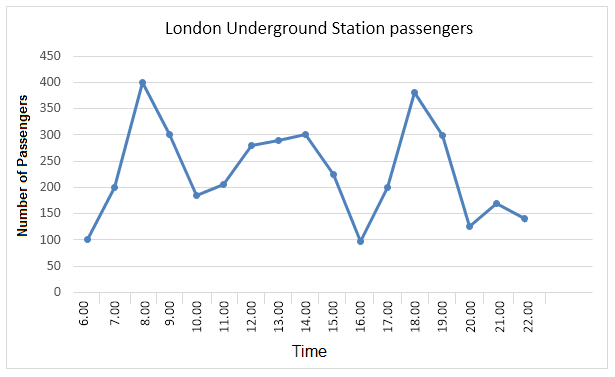
The graph illustrates data about how many people in London use the underground station.
From an
overall
perspective,Linking Words
its
readily apparent that 8'o clock is said to be the busiest hour Correct your spelling
it's
due to
schools colleges or offices.
The station is available to Linking Words
passengers
from early morning 6 as 100 people are said to be travelling at that time. Use synonyms
Thereafter
, at 7 am another 100 members get added to daily Linking Words
passengers
. There is a drastic increase in Use synonyms
passengers
travelling at peak hours following a deep decline in the Use synonyms
amount
of members travelling after 2 hours reaching 175 hours. Temperature again took progress from noon and remained very stable till 4 pm.
later half of the day , 4'o Clock in the evening experienced a lower crowd . Between 5 and 6pm station saw a soar in Change the quantifier
number
passengers
. The crowd started to decrease from 300 to 125 by 8 pm. At night even though there is slight improvement Use synonyms
its
between the range of 151 to 149Replace the word
it's
it is