
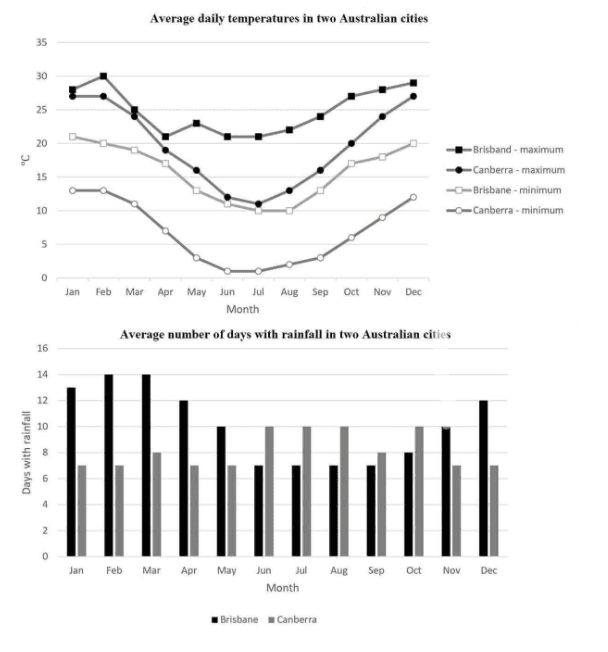
The bar chart and the line graph illustrate the statistics concerning the mean of daily extreme and minimum
temperature
in Use synonyms
degrees
Celsius and the mean of Use synonyms
days
with Use synonyms
rainfall
each month in Use synonyms
Brisbane
and Use synonyms
Canberra
.
From the first graph, the maximum temperatures in Use synonyms
Brisbane
and Use synonyms
Canberra
were the highest in the first and Use synonyms
last
month of the Linking Words
year
and the minimum temperatures were the lowest from June to August. The extreme Use synonyms
temperature
in Use synonyms
Brisbane
peaked at 30 Use synonyms
degrees
in January. The highest maximum Use synonyms
temperature
in Use synonyms
Canberra
was approximately 27 Use synonyms
degrees
during January, February, and December. The Use synonyms
temperature
in In July, the least Use synonyms
temperature
in Use synonyms
Brisbane
bottomed out at 10 Use synonyms
degrees
in continued until the end of August, in the same month the Use synonyms
temperature
in Use synonyms
Canberra
was approximately 2 Use synonyms
degrees
.
Concerning the average number of Use synonyms
days
with Use synonyms
rainfall
in these two cities. The three middle Use synonyms
months
of the Use synonyms
year
in Use synonyms
Canberra
had the most Use synonyms
days
with Use synonyms
rainfall
which was 10. Use synonyms
In contrast
, Linking Words
Brisbane
experienced the least Use synonyms
days
with Use synonyms
rainfall
during those Use synonyms
months
from June to August (roughly 7 Use synonyms
days
). For Use synonyms
Brisbane
, the most Use synonyms
days
with Use synonyms
rainfall
were in February and March (14 Use synonyms
days
). Use synonyms
On the other hand
, the minimum Linking Words
days
with Use synonyms
rainfall
recorded in Use synonyms
Canberra
were in the five first Use synonyms
months
and the two Use synonyms
last
Linking Words
months
of the Use synonyms
year
.
Use synonyms
Overall
, these two graphs have a positive correlation. During different periods of the Linking Words
year
, the number of Use synonyms
days
with Use synonyms
rainfall
Use synonyms
also
rises Linking Words
along with
the Linking Words
temperature
.Use synonyms