
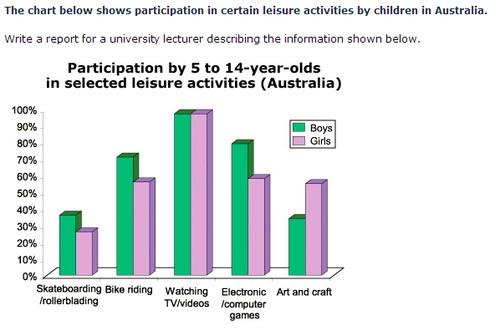
The bar chart shows the proportion of
boys
and Use synonyms
girls
, aged 5-14 years, engaging in five different activities in Australia.
The modal Use synonyms
activity
is watching TV/videos with 100% of Use synonyms
boys
and 100% of Use synonyms
girls
engaging in Use synonyms
this
form of leisure. Linking Words
Boys
overshadowed the Use synonyms
girls
in skateboarding, bike riding and electronic/Use synonyms
computer
Use synonyms
games
, Use synonyms
whereas
Linking Words
girls
were Use synonyms
the
higher proportion in arts and crafts. The largest difference in participation Change preposition
in the
of
Change preposition
in
activity
was seen in playing electronic/Use synonyms
computer
Use synonyms
games
, with approximately 80% of Use synonyms
boys
and 60% Use synonyms
Use synonyms
girls
. The least favoured Change preposition
of girls
activity
for the Use synonyms
boys
was arts and crafts, whilst it was skateboarding for the Use synonyms
girls
.
Aside from watching TV and videos, the next popular Use synonyms
activity
for Use synonyms
boys
was playing electronic/Use synonyms
computer
Use synonyms
games
, Use synonyms
meanwhile
there was a tie for the Add a comma
,meanwhile
girls
with bike riding and playing electronic/Use synonyms
computer
Use synonyms
games
; Use synonyms
thus
the next populous Linking Words
activity
, after watching TV/videos, was playing electronic/Use synonyms
computer
Use synonyms
games
.
Use synonyms
Therefore
, it is safe to say more children prefer their entertainment whilst relaxing and watching something rather than being required to physically move.Linking Words