
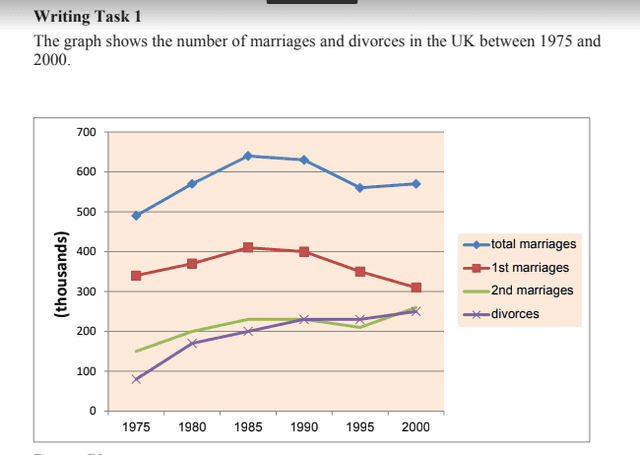
The given bar graph illustrates the comparison of the
number
of Use synonyms
marriages
and Use synonyms
divorces
for 25 years in the United Kingdom. In brief, all figures except Use synonyms
divorces
fluctuated between 1975 and 2000, Use synonyms
whereas
there was a gradual rise in the Linking Words
number
of Use synonyms
divorces
.
Moving to the details, the sections on 1st and 2nd marriage show a similar trend, with both slightly increased from approximately 340 and 150 to 400 and 220 respectively between 1975 and 1985. Use synonyms
Furthermore
, the Linking Words
number
of 1st Use synonyms
marriages
subtly dropped in the Use synonyms
number
of 1st Use synonyms
marriages
to 300 from 1990 to 2000, Use synonyms
while
there was a fluctuation between 210 and 330 in the amount of 2nd ones, and it was at 330 in 2000.
Linking Words
In addition
, total Linking Words
marriages
show the same pattern as 1st the ones, in 1975, it was 500, Use synonyms
then
inclined to over 600. After that, it declined to around 560 in 1995 and in 2000.
Linking Words
On the other hand
, the Linking Words
number
of Use synonyms
divorces
was 100 in 1975, and it soared twice in 1990. At that time it overtook the amount of 2nd Use synonyms
marriages
, Use synonyms
then
it went up to 240 in 2000.Linking Words