
This
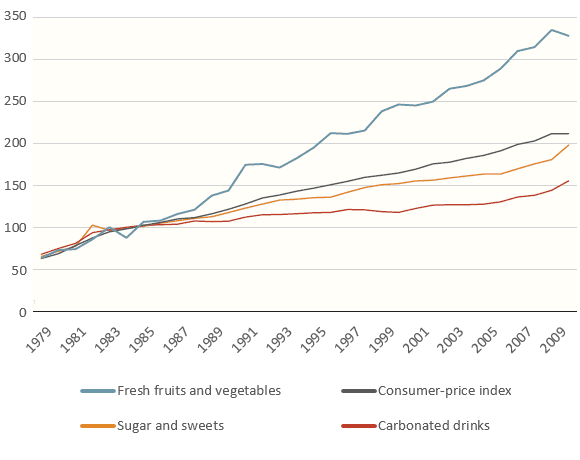
chart gives information concerning price changes of fresh fruits and vegetables, sugars and sweets, carbonated drinks, and consumer-price index between 1978 and 2009.
At the beginning of the Linking Words
period
, all prices accounted for the same figures. In 1982, sugar and sweets are temporarily increased to roughly 100. Use synonyms
On the other hand
, the consumer-price index temporarily decreased to less than 100 in 1984. After 1987, fresh fruits and vegetables rapidly increased over the Linking Words
period
. Use synonyms
This
figure rose continually to more than 300.
It is noticeable that the consumer-price index Linking Words
also
steadily increased to more than 200. Between 2007 and 2009, sugar and sweets heavily increased from 170 to 200. Linking Words
However
, the growth of carbonated drinks is slow during Linking Words
the
Correct determiner usage
this
period
.
Use synonyms
Overall
, all prices increased between 1970 and 2009. It is noteworthy that the price change of fresh fruits and vegetables was the biggest during the Linking Words
period
.Use synonyms