The chart and graph below giove information about sales and share prices for coca cola. Summarise the information by selecting and reporting the main features and male comparisons where relevant.

The chart and graph below giove information about sales and share prices for coca cola. Summarise the information by selecting and reporting the main features and male comparisons where relevant.
IELTS Writing Task Chart for The chart and graph below giove information about sales and share prices for coca cola. Summarise the information by selecting and reporting the main features and male comparisons where relevant.
✨ Do you want to improve your IELTS writing?
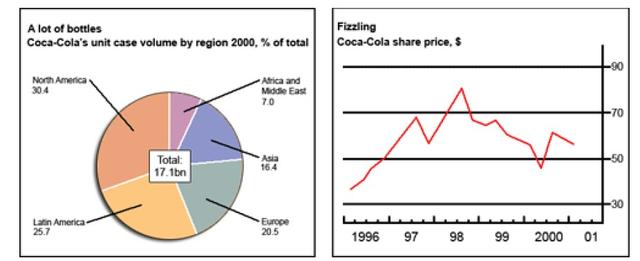
The pie chart illustrates the data about the total purchases in the percentage of Coca-cola in five regions of North
America
Use synonyms
, Latin
America
Use synonyms
, Europe, Africa and the Middle East, and Asia in 2000. The line chart represents the data about the
share
Use synonyms
price in dollars from 1996 to 2001.
Overall
Linking Words
,
sales
Use synonyms
of Coca-Cola in North
America
Use synonyms
and Latin have large volumes of
sales
Use synonyms
when compared to Europe and Asia,
while
Linking Words
Africa and the Middle East make the least volume of
sales
Use synonyms
. In terms of
share
Use synonyms
price, there was a steady increase at the start and
then
Linking Words
, fluctuation happened throughout the years. North
America
Use synonyms
and Latin
America
Use synonyms
represent a large chunk of Coca-Cola
sales
Use synonyms
at 30.4% and 25.7% respectively. The rest of the
sales
Use synonyms
volume is held by Europe at 20.5% and Asia at 16.4%. The least
sales
Use synonyms
volume of 7% is held by Africa and the Middle East. In 1996
share
Use synonyms
prices was steadily increasing from over $30 to under $70 in 1997.
Then
Linking Words
, there were slight changes in mid-1997 were
share
Use synonyms
prices fell to around $54. Followed by a sharp increase of above $70 in 1998. In the
last
Linking Words
quarter of 1998
share
Use synonyms
prices slowly fell below $70 and continued to fluctuate up and down until 2001.

Unauthorized use and/or duplication of this material without express and written permission from this site's author and/or owner is strictly prohibited. Excerpts and links may be used, provided that full and clear credit is given to Writing9 with appropriate and specific direction to the original content.

Vocabulary: Replace the words america, share, sales with synonyms.
Vocabulary: The word "chart" was used 2 times.
Vocabulary: The word "represents" was used 2 times.
Vocabulary: The word "data" was used 2 times.
Vocabulary: The word "fell" was used 2 times.
Vocabulary: The word "increase" was used 2 times.
Vocabulary: The word "about" was used 2 times.
Topic Vocabulary:
  • sales trend
  • share prices
  • seasonal fluctuations
  • correlation
  • global events
  • market analysis
  • consumer behavior
  • economic factors
  • investment decisions
  • financial performance
What to do next:
Look at other essays: