The pie charts below gives information on the proportion of carbohydrates, protein and fat in three different diets

The pie charts below gives information on the proportion of carbohydrates, protein and fat in three different diets
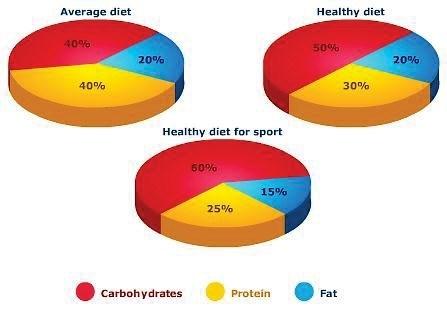
The 3 pie chart represents the data for the percentage of the 3 macronutrients which includes proteins, carbohydrates and fats in the average diet, healthy ones and the breakdown of macros which is the most optimum for sports people. In the case of carbohydrates, the number stands at 40% for the general, 50% for the nutritious and 60% for the athletic. For protein, it is 40% for the first one on the list, 30% for the second and 25% for the
last
.
Lastly
, the fat percentage holds the least value amongst all which is 20% for both normal and healthy foods and 15% for sports.
Submitted by patelharnish38 on

Unauthorized use and/or duplication of this material without express and written permission from this site’s author and/or owner is strictly prohibited. Excerpts and links may be used, provided that full and clear credit is given to Writing9 with appropriate and specific direction to the original content.

Sentences: Add more complex sentences.
Common mistake: Your writing should be 150-250 words.
Vocabulary: Only 5 basic words for charts were used.
Vocabulary: The word "percentage" was used 2 times.
What to do next:
Look at other essays: