
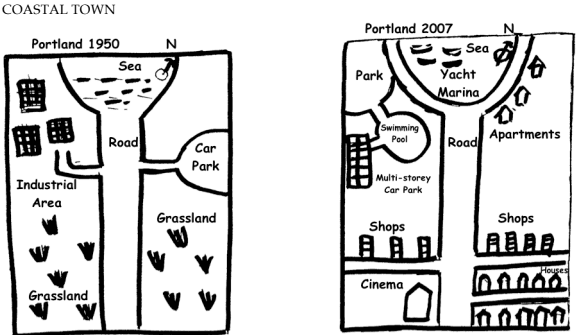
The maps below given illustrates, the before and after of a coastal
town
, it is proposed redevelopment. During the period from 1950 to 2007.
Use synonyms
Overall
, the comparison of the two maps, reveals a complete transformation, from a less rural Linking Words
area
into a more urban Use synonyms
area
.
In 1950, the Use synonyms
town
was greener with a lot of grasslands in the east part of the map. There was a road along the Use synonyms
town
from south to north and it ended to a sea. Use synonyms
Moreover
, There was an industrial Linking Words
area
just to the northwest of the map and Use synonyms
also
, a car Linking Words
park
was located in the east part just above the grassland.
To contrast, The Use synonyms
town
saw significant changes during a period of 57 years. The grasslands were completely removed and replaced by an entertainment Use synonyms
area
in the south. In the northwest of the map, the Industrial Use synonyms
area
was transformed into a multi-story car Use synonyms
park
, a swimming pool, and a Use synonyms
park
.
Use synonyms
Therefore
, the sea was just developed after the yacht marina was added. Linking Words
Also
, a residential Linking Words
area
was installed after the car Use synonyms
park
was demolished.Use synonyms