
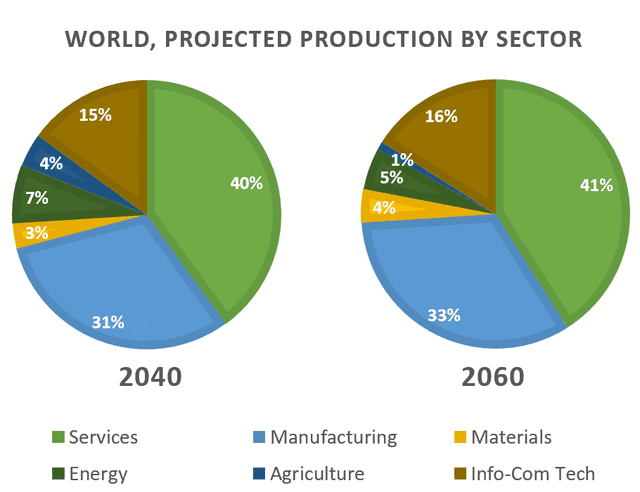
The given pie charts depict estimations for production worldwide by different sectors in the period of 2040 and 2060.
Overall
, the six illustrated areas would not change significantly. Most changes are around one to three per Linking Words
cent
.
All three sectors of services, info-com tech, and materials will slightly grow one per Use synonyms
cent
by 2060. Use synonyms
While
manufacturing will experience a gradual two percents rise, energy and agriculture will face a minor dip of two and three per Linking Words
cent
respectively.
The services are the most productive by 40 per Use synonyms
cent
and will remain at the top. As the material section will rise over the 20 years, the Use synonyms
last
part would change to agriculture by one per Linking Words
cent
in the period of 2060.
Use synonyms
To conclude
, future global production will be led by the services sector and whole areas would not experience large changes. Linking Words
Also
, agriculture will be the least productive sector by 2060.Linking Words