
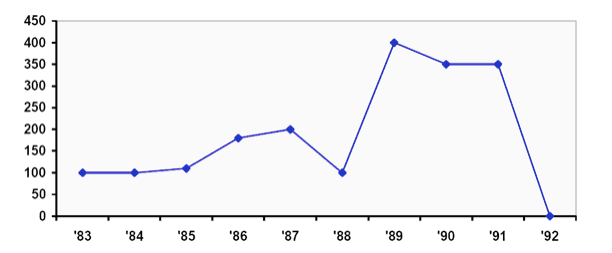
The diagram illustrates how the number of
cases
of Use synonyms
diarrhoea
changed over a period between 1983 and 1992 in Mashhad.
It is observed that in the first Use synonyms
year
(1983) the number of Use synonyms
cases
of Use synonyms
diarrhoea
stood at 100 and remained stable until 1985. Use synonyms
This
was followed by a slight increase in two years until it reached approximately 200. Linking Words
However
, there was a significant drop in 1988 when the figures were 100. Linking Words
This
downward trend was suddenly broken and the number of Linking Words
cases
of Use synonyms
diarrhoea
grew up dramatically and showed 400 Use synonyms
cases
per Use synonyms
year
. Use synonyms
This
figure maintained unchanged until 1991. Linking Words
Finally
, in 1992 the Linking Words
cases
of Use synonyms
diarrhoea
were equal to zero.
Use synonyms
Overall
, the proportion of Linking Words
diarrhoea
in Mashhad Use synonyms
last
Linking Words
year
was the lowest in other years, but the highest result was in 1998 with 400 Use synonyms
cases
per Use synonyms
year
.Use synonyms