The table below shows CO2 emissions for different forms of transport in the European Union. The Pie Chart shows the percentage of European Union funds being spent on different forms of transport. Write a report for a university lecturer describing the information shown below. CO2 emissions per passenger kilometre co2 emissions EU Funds for transport 2007-2013 eu funds for transport written by: ata bitaraf

The table below shows CO2 emissions for different forms of transport in the European Union. The Pie Chart shows the percentage of European Union funds being spent on different forms of transport. Write a report for a university lecturer describing the information shown below. CO2 emissions per passenger kilometre co2 emissions EU Funds for transport 2007-2013 eu funds for transport written by: ata bitaraf
IELTS Writing Task Chart for The table below shows CO2 emissions for different forms of transport in the European Union. The Pie Chart shows the percentage of European Union funds being spent on different forms of transport. Write a report for a university lecturer describing the information shown below. CO2 emissions per passenger kilometre co2 emissions EU Funds for transport 2007-2013 eu funds for transport written by: ata bitaraf
✨ Do you want to improve your IELTS writing?
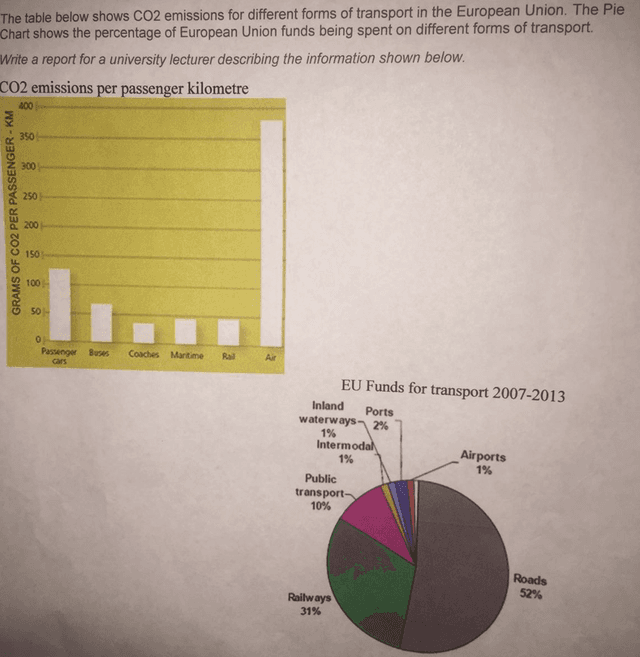
The table shows the various kinds of transportation in the European Union that produce CO2 emissions. The pie chart depicts the amount of money that people in Europe spent on several
transportation
Change to a plural noun
transportations
show examples
. By and large, There there is one kind of
transport
Use synonyms
that donates the biggest amount of pollution.
Moreover
Linking Words
, most people tend to spend their
transport
Use synonyms
budget on some kinds of
transport
Use synonyms
but there are some of them that get the larger amount. Air
transport
Use synonyms
has the highest bar with approximately 370 grams of CO2 per passenger-KM. It is followed by Passenger cars with around 130, higher than the Buses with about 60. The Rail and Maritime have the same number (40), they are higher than the Coaches which get 30. In 2007-2013, The biggest slice of the EU Funds for
transport
Use synonyms
Chart was occupied by the Roads with 52% of the proportion. In
the
Correct article usage
apply
show examples
second place, there was the Railways which got 31%. Following the Railways, Public
Transport
Use synonyms
got 10%.
In addition
Linking Words
, the Intermodal and Inland waterways have the same proportion (1%), it was lower than the one from Ports which got 2%.

Unauthorized use and/or duplication of this material without express and written permission from this site's author and/or owner is strictly prohibited. Excerpts and links may be used, provided that full and clear credit is given to Writing9 with appropriate and specific direction to the original content.

Vocabulary: Replace the words transport with synonyms.
Vocabulary: Rephrase the word "shows" in your introduction.
Vocabulary: The word "chart" was used 2 times.
Vocabulary: The word "amount" was used 3 times.
Vocabulary: The word "proportion" was used 2 times.
What to do next:
Look at other essays: