
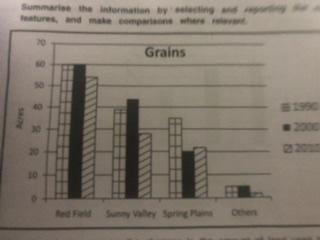
As an introduction, the bar chart demonstrates how the land was allocated for the purpose of cultivating grains in a particular state in Canada, from 1990 to 2010.
Overall
, it can be seen that the largest cultivated area of all fields Linking Words
in
all times was Change preposition
at
red
field, Add an article
a red
the red
while
the smallest was other lands. Linking Words
In addition
, plantations reduced significantly in the later stages compared to early years Linking Words
at
all places.
Change preposition
in
Firstly
, grain cultivation Linking Words
area
on red Fix the agreement mistake
areas
field
, sunny Fix the agreement mistake
fields
valley
and other planes between 1990 and 2000 were approximately similar in numbers at 60, around 40 and 5 respectively, Fix the agreement mistake
valleys
whereas
in 2010, the figures showed a slight decline by about 5, 14, and 2.5 from that of 2000, respectively.
When considering spring planes, Linking Words
number
of acres of land used for Change the article
a number
the number
plantation
was around 35 in 1990. Fix the agreement mistake
plantations
However
, Linking Words
this
figure went down by approximately 10 acres in 2000Linking Words
,
and remained relatively stable until 2010 at around 20.Remove the comma
apply