
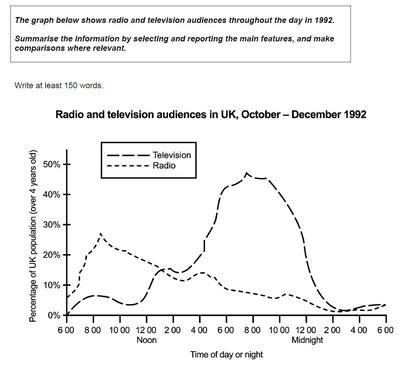
The illustration depicts the data for
radio
and Use synonyms
TV
viewers in the United Kingdom from October until December 1992. The graph shows the correlation between the percentages of people in the UK that watch or view Use synonyms
TV
or Use synonyms
radio
from 1 AM until 11 PM. A brief examination shows that the Use synonyms
radio
win happens during the day Use synonyms
while
the Linking Words
TV
takes place at night.
The data starts at 1 AM when Use synonyms
TV
have higher audiences by less than 5%. After midnight passed, the Use synonyms
radio
listeners had a tremendous spike from below 5% to 25% within 1 hour. During Use synonyms
this
time, Linking Words
radio
had its peak at 9 AM Use synonyms
while
Linking Words
TV
viewers were only around 5%.
Use synonyms
However
, after having their lowest numbers at 11 AM, Linking Words
TV
shows start to gain their audience and had their highest value at 9 PM with almost 45%. When Use synonyms
this
occurs, the difference between Linking Words
TV
and Use synonyms
Radio
is almost 40% with Use synonyms
Radio
only having 5%.Use synonyms