
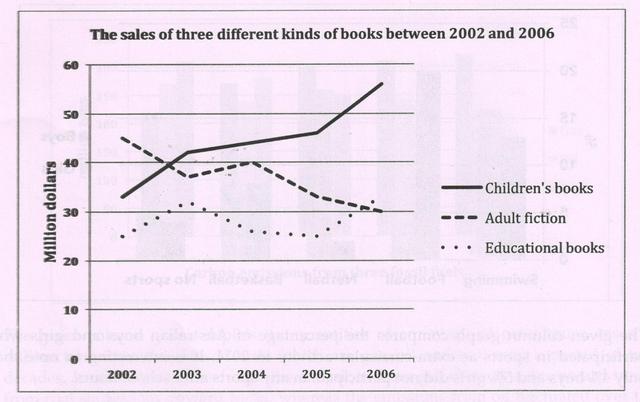
The given line graph illustrates the information about
sales
of three different types of Use synonyms
books
. It is evident that the population showed an upward trend,Use synonyms
whereas
educational Linking Words
books
and Use synonyms
children
's Use synonyms
books
showed a fluctuating trend.
From 2002 to 2003, adult fiction was on top with a sale of 45 Use synonyms
million
Use synonyms
dollars
, followed by educational Use synonyms
books
at 26 Use synonyms
million
Use synonyms
dollars
and Use synonyms
children
's Use synonyms
books
at 35 Use synonyms
million
Use synonyms
dollars
.After a few ,fluctuations the sale of Use synonyms
children
's Use synonyms
books
climbed to 55 Use synonyms
million
Use synonyms
dollars
by 2006. In ,contrast educational Use synonyms
books
were the least sold in 2002.There was a dramatic escalation in adult fiction by 2006 peaking at 33 Use synonyms
million
Use synonyms
dollars
Use synonyms
Sales
of Use synonyms
children
's Use synonyms
books
started at 32 Use synonyms
million
Use synonyms
dollars
in 2002Use synonyms
,
but rose rapidly to 45 Remove the comma
apply
million
Use synonyms
dollars
in 2003. From 2003 to 2005 there was a very slight increase in Use synonyms
sales
, but after 2005, Use synonyms
sales
grew considerably and reached an all-time high of 56 Use synonyms
million
.
Use synonyms
Overall
, Linking Words
children
's Use synonyms
books
became a trend in 2006Use synonyms