
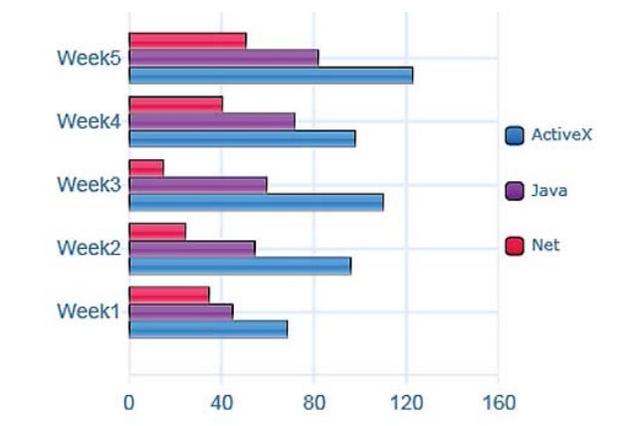
The given column chart illustrates how much
time
is used for downloading 3 programs Use synonyms
such
as Active x, Linking Words
Java
and Net from the internet over 5 weeks.
Use synonyms
Overall
, in all weeks, the amount of Linking Words
time
for downloading Active x took first place, Use synonyms
then
Linking Words
Java
and Net were at lower stages, respectively, Use synonyms
Also
the most Linking Words
time
consummation in all 3 packages happens in Use synonyms
week
5.
In Use synonyms
week
1, the figure for Active x was about 70000 seconds and except in Use synonyms
week
4 (100000s ), the rate of downloading rose moderately by 50000 seconds. Use synonyms
Moreover
, downloading Linking Words
Java
saw a minimal increase from 50000s to 85000s during Use synonyms
this
period. Linking Words
In addition
, at the first Linking Words
time
of the report, the Use synonyms
time
used for downloading Net was 35000s and in Use synonyms
week
3 stood at the lowest Use synonyms
time
( 15000s) which is 1/7 times as many hours as Use synonyms
Java
in Use synonyms
this
Linking Words
week
, Use synonyms
then
after 2 weeks reach a maximum of approximately 5000s.Linking Words