
The graph reveals the repetition of downloading three different applications each
week
during a five-Use synonyms
week
period.
Use synonyms
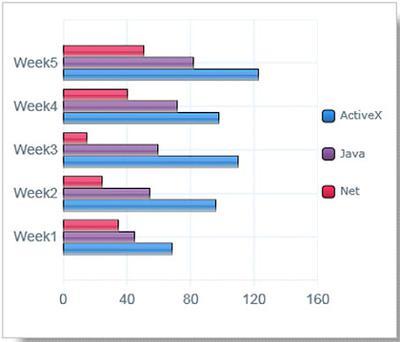
Overall
, as can be vividly seen from the bar chart, Linking Words
although
all given packages underwent an upward trend, the only one that climbed steadily and without any variation was Java. Linking Words
Moreover
, the highest number of downloading over the period given belonged to ActiveX, Linking Words
whereas
the lowest number was allocated to Net.
As illustrated by the graph, from Linking Words
week
1 to Use synonyms
week
3, the figures for ActiveX and Java increased gradually, from about 70,000 to 110,000 and just over 40,000 to 60,000, respectively. Use synonyms
However
, Linking Words
Net
witnessed an opposite pattern and fell enormously from 35,000 to nearly 10,000.
Correct article usage
the Net
By contrast
, between Linking Words
week
3 and Use synonyms
week
5, all applications experienced a substantial jump. More precisely, the figures for Use synonyms
Net
grew drastically to almost 50,000. The same pattern transpired for Java, and the numbers increased by around one-half to just over 80,000. ActiveX, Correct article usage
the Net
on the other hand
, underwent a considerable decline before jumping tremendously to nearly 121,000.Linking Words