
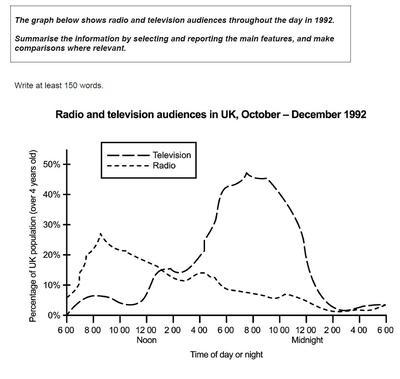
The line graph illustrates the proportions of people who listened to the
radio
and watched Use synonyms
TV
in the UK over a 24-hour in one year, 1992. Use synonyms
Overall
, it can be seen that early wakers were fans of Linking Words
radio
programs, whilst televisions entertained more people in the afternoon. It is Use synonyms
also
clear that more people were interested in Linking Words
TV
than Use synonyms
radio
throughout the day.
In detail, nobody watched Television at 6 am, Use synonyms
while
Linking Words
this
number was more than 5% for the Linking Words
radio
. It Use synonyms
then
sharply grew to less than one-third at 8 am, when, apart from two small rises at 4 Linking Words
pm
and 11 Use synonyms
pm
steadily decreased to approximately 1% at 2 am and remained at Use synonyms
this
level until 6 am.
In sharp contrast to Linking Words
this
, the Linking Words
TV
watchers went up gradually in the morning until 2 Use synonyms
pm
, the time that it skyrocketed to less than 50% at 8 Use synonyms
Use synonyms
pm
. Correct your spelling
p.m
However
, the Linking Words
TV
audiences sharply fell in the late evening, from 10 Use synonyms
pm
to midnight and reached the almost same levels as Use synonyms
radio
listeners.Use synonyms