
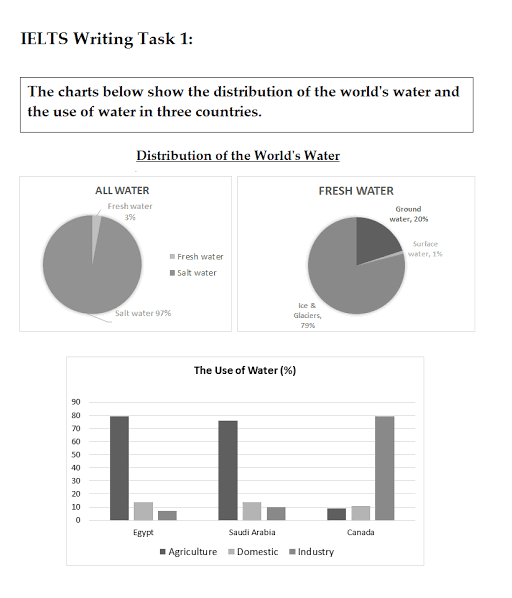
The pie charts describe the distribution of
water
in the world, Use synonyms
while
the bar chart gives information regarding the Linking Words
use
of Use synonyms
water
in Egypt, Saudi Arabia, and Canada.
Use synonyms
Overall
, the world's Linking Words
water
is mostly salt Use synonyms
water
and not fresh. Use synonyms
This
Linking Words
freshwaterwater
is mostly found in ice and glaciers. Egypt and Saudi Arabia Correct your spelling
freshwater water
use
mostly Use synonyms
water
for agricultural Use synonyms
use
Use synonyms
while
Canada for industrial Linking Words
use
.
Use synonyms
Salt
Correct your spelling
Saltwater
water
constitutes 97% of Use synonyms
Use synonyms
water
on our planet but only 3% is fresh Add an article
the water
water
. Fresh Use synonyms
water
is mostly found in ice and glaciers 79%. Use synonyms
Then
Linking Words
ground
Correct your spelling
groundwater
water
and surface Use synonyms
water
constitute the remaining sources by 20% and 1% Use synonyms
respictively
.
Egypt and Saudi Arabia show similar patterns of Correct your spelling
respectively
use
of Use synonyms
water
with just under 80% for agriculture, Use synonyms
and
just above 10% for domestic Correct word choice
apply
use
, and 10% or less for industry purposes. Use synonyms
However
, Canada shows an opposite trend with almost 80% of the Linking Words
water
used for industry, Use synonyms
then
around 10% for both farming and local Linking Words
use
.Use synonyms