
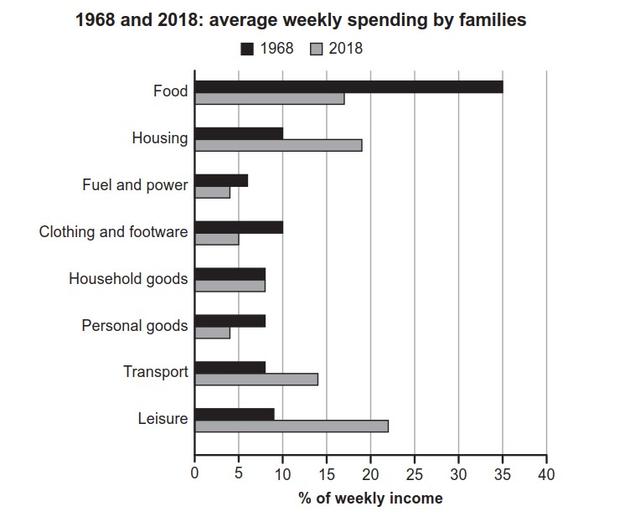
The bar chart details the average weekly spending for families in a given country in 1968 and 2018. Looking from an
overall
perspective, it is readily apparent that Linking Words
while
spending for Linking Words
food
, fuel and power, clothing and footwear, and personal Use synonyms
goods
declined, the inverse was true for the remaining categories, with only household Use synonyms
goods
unchanged. Use synonyms
Although
spending on Linking Words
food
was by far the most common in 1968, by 2018 leisure occupied most of the family budget, followed closely by housing.
In 1968, families spent, on average 35% of their weekly income on Use synonyms
food
, significantly outstripping other budgetary concerns, each of which represented between 5% and 10%. Among these, fuel and power were the lowest at 6%.
By 2018, spending patterns diverged more widely. Use synonyms
Food
represented a still significant 17% of the budget, trailing housing at 19% (a 9% Use synonyms
overall
rise) and leisure at 22% (a 13% increase). Transport Linking Words
also
displayed a notable growth of 14%. Fuel and power, clothing and footwear, and personal Linking Words
goods
fell to 4%, 5%, and 4%, respectively. Household Use synonyms
goods
were the only expense to remain fixed, at 7%.Use synonyms