
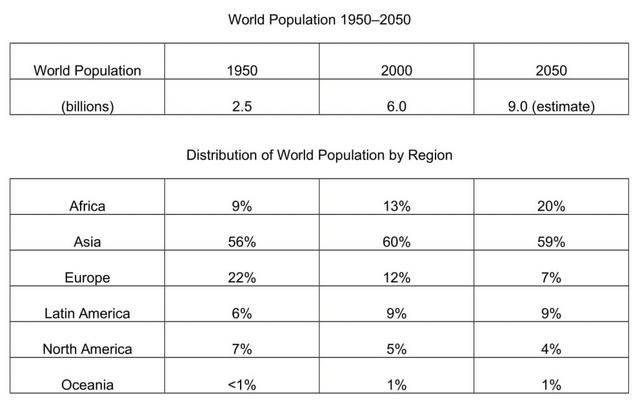
The table compares changes in the worldwide population distribution between the six key regions from 1950 to 2000, with predictions for the year 2050.
The only region where the percentage
contribution
is expected to increase by 2050 is Africa, Use synonyms
while
Europe is expected to have the greatest drop in proportion over the same time span. The sole continent showing a fluctuation in percentage Linking Words
contribution
over the hundred-year period is Asia.
From a relatively small percentage Use synonyms
contribution
of 9% in 1950, the people of Africa are forecast to make up a fifth of the total world population by 2050. Use synonyms
This
is almost a reversal of the situation for Europe which stood at 22% in 1950 and is expected to continue its steady decline to reach just 7% in 2050.
Another notable trend can be seen in the data for Asia which is the only region to show an increase in proportion Linking Words
contribution
over the first fifty years from 56% to 60% but the prediction of a decline, albeit small, looking forward to 2050. The remaining regions, North America, Latin America and Oceania each make up less than 10% of the total world population and show only minor fluctuations in Use synonyms
contribution
over the whole time period.
.Use synonyms