
The bar graph illustrates how many
times
a Use synonyms
week
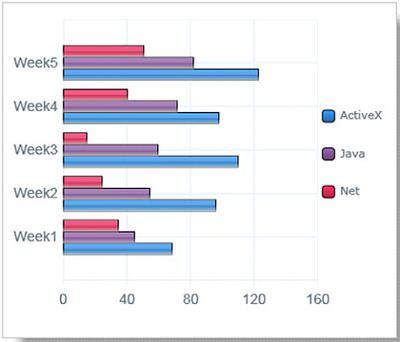
three types of computer packages were downloaded in the 1000s, over a period of five weeks.
Use synonyms
Overall
, Linking Words
it is clear that
the rank of these 3 types did not change, with Linking Words
ActiveX
topping the chart and Net being the lowest. Use synonyms
Besides
, there was an upward tendency in the data throughout the years.
In detail, in the first Linking Words
week
, the data for Use synonyms
ActiveX
was 70 Use synonyms
times
, 20 and 40 units higher than that of Use synonyms
Java
and Net, respectively. A Use synonyms
week
after that, Use synonyms
ActiveX
and Use synonyms
Java
witnessed an increase to 100 and 60 units, Use synonyms
while
the figure for Net decreased to 20 Linking Words
times
. Use synonyms
This
trend applied Linking Words
similarly
to Linking Words
Week
3 as the record for Use synonyms
ActiveX
was 110, followed by 65 for Use synonyms
Java
and 10 for Net.
It is Use synonyms
also
worth mentioning that when Linking Words
Java
and Net obtained a significant rise, at 40 and 70, in that order, the sum of downloaded Use synonyms
times
of Use synonyms
ActiveX
fell down 10 Use synonyms
times
. In the Use synonyms
last
Linking Words
week
of the period, all kinds of computers, namely Use synonyms
ActiveX
, Use synonyms
Java
, and Net grew to reach their peaks at 50, 80, and 120, correspondingly.Use synonyms