
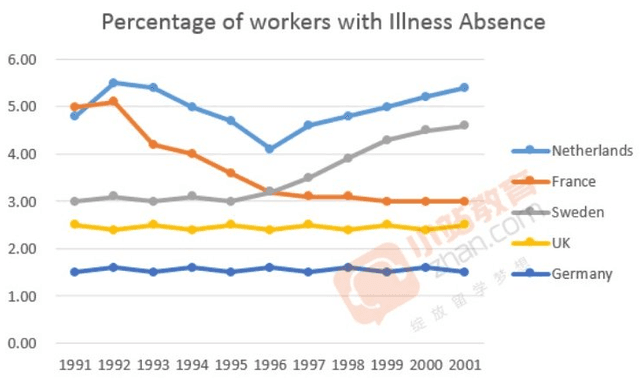
The line graph depicts changes in the percentages of workers’ sickness absence in 5 countries in the period 1991-2001.
As can be seen from the chart, the Netherlands employees had the most days off
whereas
the Germans took the fewest. Linking Words
In addition
, Linking Words
while
all the countries witnessed substantial changes, the proportions of Germany and the UK were rather consistent.
To commence with, the absence rate of the Netherlands reached a high of 5.6% in the first 2 Linking Words
years
, Use synonyms
whereas
the French remained flat at 5%. In the next 4 Linking Words
years
, both figures experienced a dip at 4% and 3.2% respectively, and following the Use synonyms
last
5 Linking Words
years
, they diverged with the Netherlands increasing steadily and ending at 5.5% and the French fell and levelled off at around 3%.
In terms of Sweden, the absence percentage remained around 3% of the workers there from sickness from 1991 to 1995. In the next 6 Use synonyms
years
, Use synonyms
however
, it rose considerably and peaked at roughly 4.6% in 2001.
Regarding the UK and Germany, the workers there took far fewer days off than in the two aforementioned countries. They initiated at 2.7% and 1.3% sequentially and fluctuated in an upward trend throughout the time span. Linking Words
At the end
of 2001, the percentage of English was 2.8% Linking Words
while
that of the Germans was 1.4%.Linking Words