
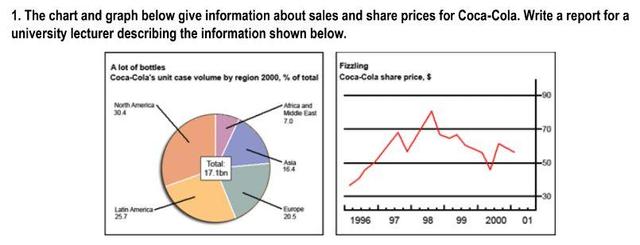
The two charts given provide information about the worldwide distribution of sales and
share
prices for Coca-Cola from 1996 to 2001. The pie chart illustrates Use synonyms
volume
of Coca-Cola users in five specific regions, Add an article
the volume
while
the line graph Linking Words
reveal
the Change the verb form
reveals
share
Use synonyms
price
over the given period.
Use synonyms
Overall
, it is explicit that North America hold a lion’s Linking Words
share
of Use synonyms
unit
case, Add an article
the unit
while
Africa and Linking Words
Middle
East hold a tiny fraction. Correct article usage
the Middle
Also
, the figure for Linking Words
Coca-Cola
Change noun form
Coca-Cola's
share
Use synonyms
price
grew substantially in the past 5 years.
Use synonyms
Firstly
, in 2000, Coco-Cola Linking Words
is
sold around 17,1 billion cases of total sales. The largest consumer was North America, which accounted for 30,4% of total users. Following by Latin America, as the Unnecessary verb
apply
second ranked
leader, constitute a quarter Add a hyphen
second-ranked
for
the figure. Europe and Asia took up 20,5 and 16,4, respectively. Of the five regions, Africa and Change preposition
of
Middle
East have the lowest proportion of Coca-Cola’s unit case volume.
Since 1996, Correct article usage
the Middle
the
Coca-Cola’s division Correct article usage
apply
Use synonyms
price
witnessed Fix the agreement mistake
prices
a
erratic pattern. Noticeably, the highest figures were recorded in mid-1998, at approximately 85$. After that peaked point, the figure of Change the article
an
share
Use synonyms
price
dwindle to below 70$. Between mid-1998 and 2000, the Use synonyms
price
considerably dropped and Use synonyms
then
levelled off at around 60$.Linking Words