
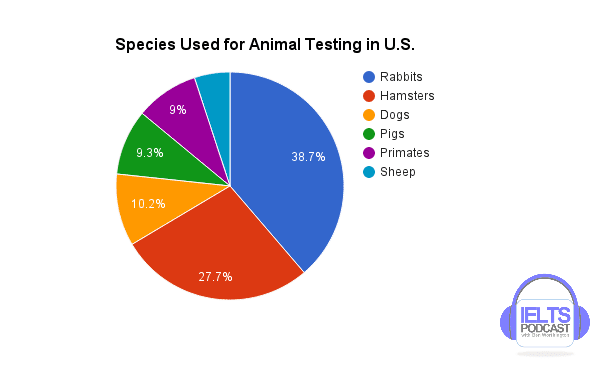
The pie chart illustrates the percentage of six animal species used in research experiments in the US.
Overall
, the most used animals for running experiments were , in the first place ,rabbits and , in second place ,hamsters. The animals ,which were on the list used were sheep and primates.
Linking Words
According to
the pie chart, the most useful creatures for animal testing were rabbits, with a percentage of 38.7%. Linking Words
Secondly
, hamsters were one of the most useful animals for testing , representing 27.7%. Linking Words
Additionally
,some tests were run on dogs too ,but only 10.2%.
Linking Words
Moreover
, pigs represent 9.3% of species used for animal testing, Linking Words
while
having approximately the same number as primates, 9%. Linking Words
Lastly
, the creatures that were used on the list for testing are sheep, with a percentage lower than 7.5%. The Linking Words
last
three categories of mammals, sheep,primates and pigs were not as useful in running experiments as dogs, hamsters and rabbits.Linking Words