
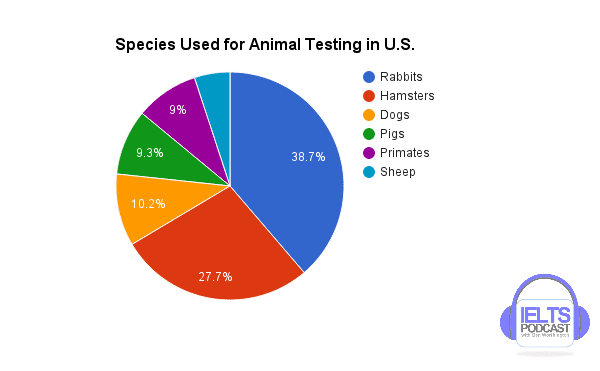
The given pie chart depicts figures about the ratio of various kinds of animals for study in the United States with the help of kinds of creatures. These are described below in the given paragraphs.
From the overview, it is crystal clear that the majority of living creatures used for testing were rabbits,
whereas
sheep had the least proportion in data. All the revealed things are very informative and have sorts of details.
Linking Words
To begin
with, 38.7% of the animals were rabbits which were used for investigation by scientists. Linking Words
Moreover
, the number of hamsters was 27.7%, which was second top in the given types. Linking Words
However
, the percentile of dogs was 10.2% of all species.
Rolling towards the rest of the information, Pigs and Primates were having the same numbers with a minor difference of 0.3%. Linking Words
Furthermore
, the count of sheep was undefined, yet it is shown at they were having least percentage among all.Linking Words