
The bar
chart
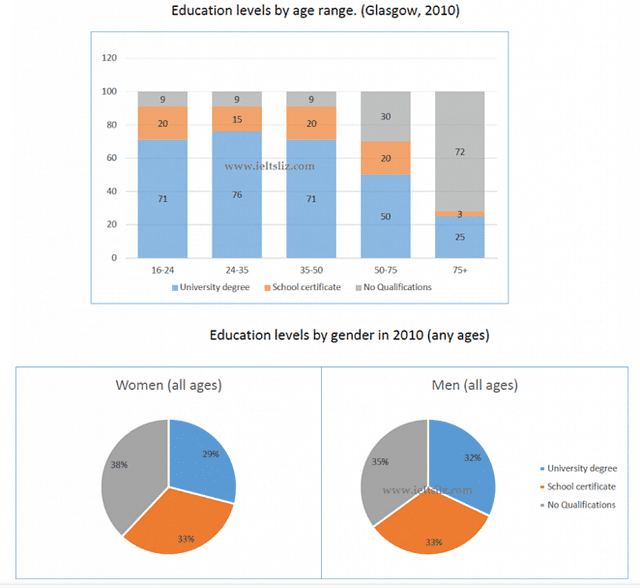
depicts some details about the level of learning or studying in Glasglow in Scotland, during 2010, Use synonyms
Whereas
, In the pie Linking Words
chart
, it is described the generation of education Use synonyms
Use synonyms
degree
.
Fix the agreement mistake
degrees
Overall
, Linking Words
this
bar Linking Words
chart
, it is shown a high age range which is in the University Use synonyms
degree
, approximately 68, Use synonyms
While
, in the pie Linking Words
chart
, It is identified big age Use synonyms
that is
in no qualifications when it is contrasted in both women and Linking Words
men'
age.
Given the Change noun form
men's
chart
, The most acquired education level is in University Use synonyms
degree
in 2010. But, In the ,end their Use synonyms
degree
is reduced step by step. The lowest Use synonyms
degree
is in school certificate beginning 16-24 till 75+ it is indicated the lowest Use synonyms
degree
.
In the pie Use synonyms
chart
, we can see that No qualifications for both genders gave a high range, which is 38% and 35%. The second per cent is in school certificates, accounting for the same 33%. The Use synonyms
last
percentage is in University degrees, there is a little growth in men ratherLinking Words
thanthan
women, which is 29% and 32% respectively.Correct your spelling
than than
than that