
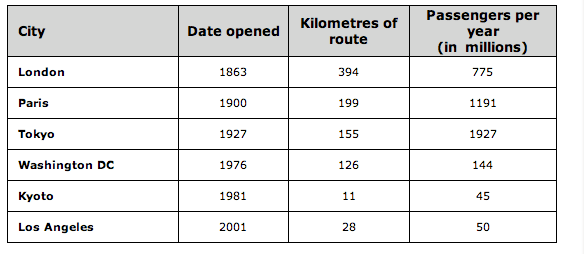
The table provides information about underground railway systems in six different cities.
Overall
, the table shows the Linking Words
year
each railway opened, its length in kilometres, and the number of Use synonyms
passengers
who use it each Use synonyms
year
. It's clear that the three oldest railways are Use synonyms
also
the longest and carry the most Linking Words
passengers
.
London has the oldest underground, which started in 1863. It Use synonyms
also
has the longest Linking Words
route
, with 394 kilometres. Use synonyms
However
, it carries the third highest number of Linking Words
passengers
, at 775 Use synonyms
million
per Use synonyms
year
, behind Paris and Tokyo. Paris, which opened in 1900, transports around 1,191,000,000 people annually over 199 Use synonyms
km
of track. Tokyo, despite opening in 1927, carries the most Use synonyms
passengers
, at 1,927 Use synonyms
million
, even though its Use synonyms
route
is only 155 Use synonyms
km
long.
As for the other underground systems, Washington Use synonyms
DC
is the oldest, opening in 1976, Punctuation problem
, DC
while
Kyoto and Los Angeles opened in 1981 and Linking Words
2001
respectively. Washington Punctuation problem
2001,
DC
has a Punctuation problem
, DC
route
of 126 Use synonyms
km
and transports 144 Use synonyms
million
Use synonyms
passengers
each Use synonyms
year
. Kyoto has the shortest Use synonyms
route
, only 11 Use synonyms
km
, and the fewest Use synonyms
passengers
, at 45 Use synonyms
million
. Use synonyms
Finally
, Los Angeles has a Linking Words
route
of 28 Use synonyms
km
and 50 Use synonyms
million
Use synonyms
passengers
.Use synonyms