
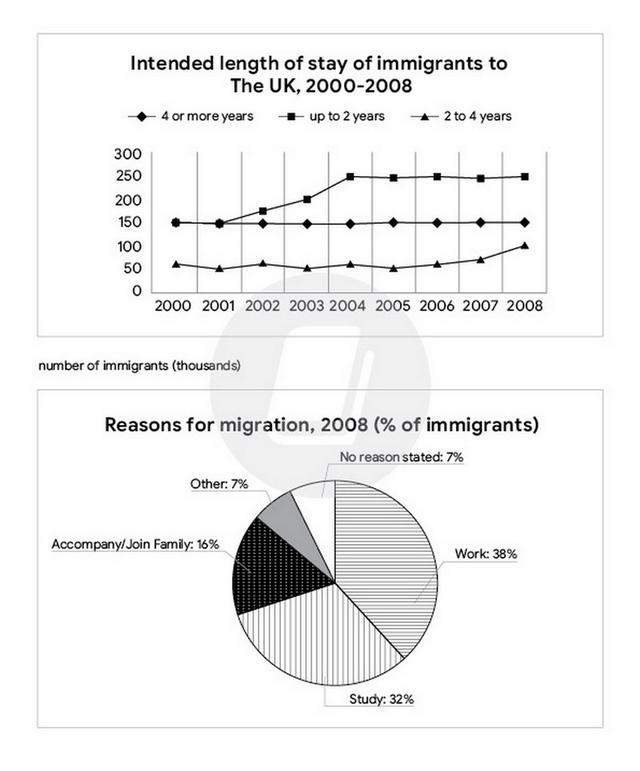
The two graphs give information on the volume of
foreigner
settlers to the UK. The bar chart illustrates the intended living time span of settlers from 2000 to 2008, Replace the word
foreign
while
the pie chart reveals the implications for immigration in 2008.
Linking Words
Overall
, it can be seen that the number of people staying up to 2 Linking Words
years
was the largest and outstripped the other categories during the period. Use synonyms
Furthermore
, going to work was the main reason why most Linking Words
of
people choose to stay in the UK.
As the line graph shows, a large proportion of immigrants decided to live in the UK for two Change preposition
apply
years
, which started at around 150,000 people, Use synonyms
subsequently
it witnessed Linking Words
a
significant growth during the Remove the article
apply
time line
. Correct your spelling
timeline
Also
, the category of 4 or more Linking Words
years
experienced the same starting point as the category of up to 2 Use synonyms
years
, in mid-2001, it slightly dropped to 140,000, but Use synonyms
then
quickly recovered its original position and levelled off. Linking Words
In addition
, the figure for 2 to 4 Linking Words
years
jumped very Use synonyms
steady
from 65,000 in the first year to 100,000 in the Change the adjective
steadily
last
year.
Turning to the pie chart, it is worth noticing that work accounted Linking Words
roughly
two-fifths of the immigrants, whilst Change preposition
for roughly
percentage
of education reasons made up above a quarter. Followed by accompany or join family, its proportion halved the figure for study. Add an article
the percentage
Furthermore
, the lowest could be seen in other reason and no reason stated at 7% and 1%, respectively.Linking Words