
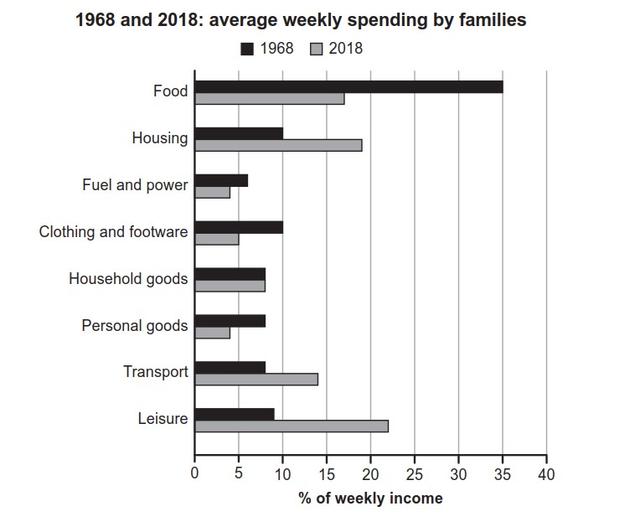
The bar chart presents the data that shows an example of one country in the past five decades and how families used to spend their weekly salary.
It can be seen that the amount of cash they speeding on food is the highest in 1968 which have reached 35 per
cent
of their weekly earnings, Use synonyms
while
in 2018 the amount of money fell slightly to 20 per Linking Words
cent
of their weekly pay. Use synonyms
However
, families in 1968 spent 8 per Linking Words
cent
of their income on leisure, but Use synonyms
this
amount of the bill increased sharply in 2018 to become 22 per Linking Words
cent
of their weekly pay.
Housing and transport have increased a lot in the Use synonyms
last
5 decades, families spent 10 per Linking Words
cent
in 1968 but in 2018 it raised 8 per Use synonyms
cent
. Use synonyms
Moreover
, with transport, they spend 8 per Linking Words
cent
in 1968 but in 2018 they put twice their weekly income on it.
Use synonyms
Overall
, we can see a clear upward trend in their weekly cash went for food in 1968, Linking Words
while
the majority of spending funds was leisure in 2018.Linking Words