
The line graph illustrates the difference in numbers in terms of
birth
and Use synonyms
death
in Newzland within a Use synonyms
two hundred-year
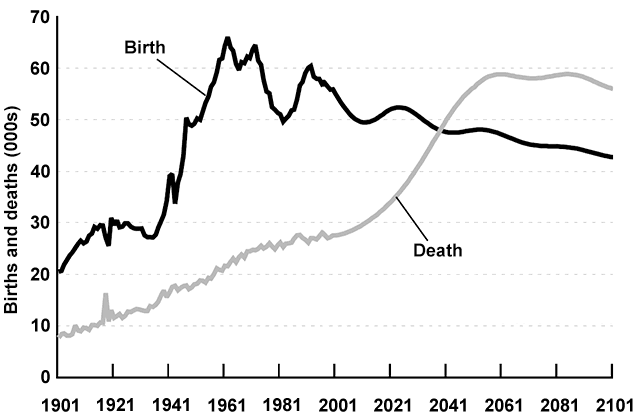
period from 1901 to 2101. Add a hyphen
two-hundred-year
Overall
the number of births is estimated to fluctuate throughout the given time whilst that of Linking Words
death
is projected to experience an upward trend.
ln 1901, the rate of Use synonyms
birth
was the highest and stood at 1000s. Use synonyms
Then
it fluctuated throughout the years until 1941 when it rose significantly to the 50000s. Afterwards, the standard of Linking Words
birth
rocketed to nearly 70000s in 1961. From there Use synonyms
birth
rate is estimated to experience a downward trend reaching that of Use synonyms
death
at around 48000s by 2041 and Use synonyms
subsequently
decreasing to about 43000s by 2101.
The Linking Words
death
rate Use synonyms
Linking Words
however
, stood at 1000s in 1901. It Add the comma(s)
,however
then
rose steadily to just below 30000s in 2021. After which, it is forecasted to experience a surge to almost 60000sby 2061 from there remain constant.Linking Words
Linking Words
Subsequently
decrease slightly to a little below 60000s in 2101.Add a comma
,Subsequently