
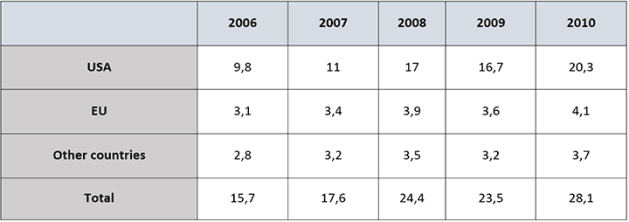
The given table illustrates the financial funds that
America
, European and other countries allocated to developing ones from 2006 to 2010.
Use synonyms
Firstly
, in 1995 in ,Africa it was less than 6000 and other to rest of the countries. Linking Words
Secondly
, in 2000 in,Europe it was nearly 6000 and in other rear nations. Linking Words
Thirdly
, in 2005 in Latin Linking Words
America
and the Use synonyms
,
Caribbean it was nearly 6000 and great to nations. In 2010 North Remove the comma
apply
America
between 5000 and 7000 up to 38000 to other nations. In 2011 Oceania was more than 6000 upto 35000. In 2012 in ,Asia it was more than 6000 Use synonyms
till
37000. In 2013 Africa was nearly 5500. In 2014 it was around 6000 and up to 36000. In 2015 Occenina is nearly 6000 and up to 38000. In 2016 Latin Change preposition
to
America
and the Caribbean were between 6000-7000.
Use synonyms
To conclude
, the highest was in 2015 and the lowest was in 1995. More Employment in million was to Asia. The above data Linking Words
described
in the table.Add a missing verb
is described