The pie charts below give information about the composition of household rubbish in the United Kingdom in two different years. Summarise the information by selecting and reporting the main features, and make comparisons where relevant.

The pie charts below give information about the composition of household rubbish in the United Kingdom in two different years.

Summarise the information by selecting and reporting the main features, and make comparisons where relevant.
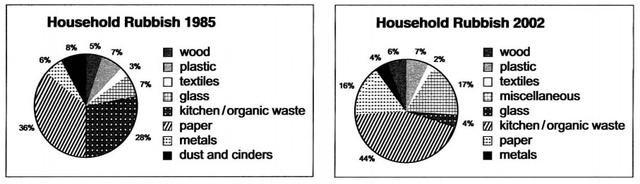
The pie charts illustrate the main things of
families
Change noun form
families'
family's
show examples
trash in the UK between 1985 and 2002.
Overall
,
while
the largest proportion of organic waste decreased, textiles remind the smallest percentage of apply all
period
Fix the agreement mistake
periods
show examples
in question.  Is clear that in 1985, paper
the
Add a missing verb
had the
show examples
largest proportion of household rubbish (36%).
This
figure decreased to 16% in the
last
year.
In addition
,
the
Correct article usage
apply
show examples
organic waste rose to 44% in 2002, from 28% in 1985.
According to
the figures, textiles a
most
Change the adjective
apply
show examples
smallest part of rubbish. It stood at 3% in 1985 and reached 2% in 2002. By ,contrast wood decreased through the 17-year period, from 8% in 1985 to a mere 4% in 2002.
Submitted by pasha2400 on

Unauthorized use and/or duplication of this material without express and written permission from this site’s author and/or owner is strictly prohibited. Excerpts and links may be used, provided that full and clear credit is given to Writing9 with appropriate and specific direction to the original content.

Sentences: Add more complex sentences.
Common mistake: Your writing should be 150-250 words.
Vocabulary: The word "figure" was used 2 times.
Vocabulary: The word "proportion" was used 2 times.
Vocabulary: The word "decreased" was used 3 times.
What to do next:
Look at other essays: