The bar chart shows the monthly spending in dollars of a family in the USA on three items in 2010. Summarize the information and make a comparisons where relevant. Write at least 150 words

The bar chart shows the monthly spending in dollars of a family in the USA on three items in 2010. Summarize the information and make a comparisons where relevant. Write at least 150 words
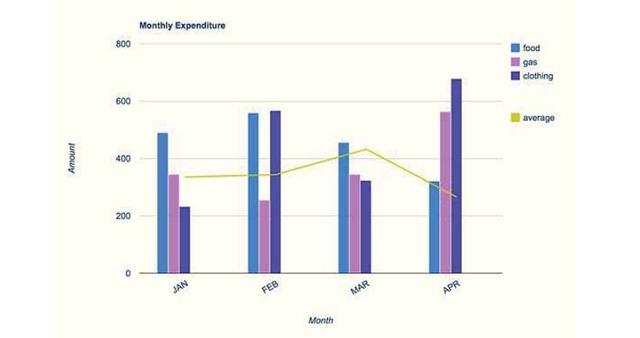
The bar chart illustrates the monthly expenditure of a family in the USA on
food
,
gas
and clothing in 2010. It is clear from the chart that the average of dollars slightly increased in March and it suddenly fell down in April.
Overall
, the amount of clothing and
gas
rise more in April than in January.
In other words
, the amount of
food
and clothing steadily the same in February.
On the other hand
, the spending money on
gas
decreased by about 350 dollars. What is more, the monthly expenditure in March slightly rises in
food
than
gas
and clothing by about 100 to 120 dollars.
Moreover
, the average spending money in January on their items is different and the
food
increased than others.
Submitted by m on

Unauthorized use and/or duplication of this material without express and written permission from this site’s author and/or owner is strictly prohibited. Excerpts and links may be used, provided that full and clear credit is given to Writing9 with appropriate and specific direction to the original content.

Sentences: Add more complex sentences.
Common mistake: Your writing should be 150-250 words.
Vocabulary: Replace the words food, gas with synonyms.
Vocabulary: The word "chart" was used 2 times.
Vocabulary: The word "amount" was used 2 times.
Vocabulary: The word "increased" was used 2 times.
Vocabulary: The word "rise" was used 2 times.
Vocabulary: The word "about" was used 2 times.
Vocabulary: The word "slightly" was used 2 times.
What to do next:
Look at other essays: