
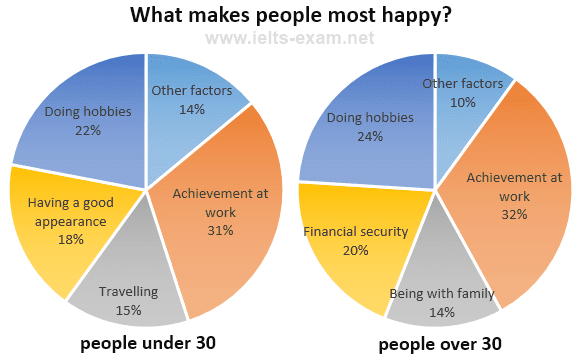
The pie charts illustrate the outcome of a survey which depicts the various factors that lead to happiness in adults under 30 and above that age.
Overall
, the maximum number of Linking Words
people
in both categories describe that achievement in work gives them a sense of satisfaction with 31% in the age group younger than 30 and 1 per cent more in Use synonyms
people
older. The second-highest activity that Use synonyms
people
find pleasure in is being engaged in their hobbies, with 22% denoting the former and 24%, the latter.
In comparison to the younger population, to the middle-aged individuals, financial security provides them solace( 20%) Use synonyms
while
, to the youth maintaining a good appearance brings them joy(18%). Linking Words
Additionally
, the significant difference which is observed is Linking Words
people
above 30 like spending time with their family Use synonyms
whereas
, the youth like travelling (15%). Other factors which are not specified by the former(10%) and latter(14%) are found to be the least.Linking Words