
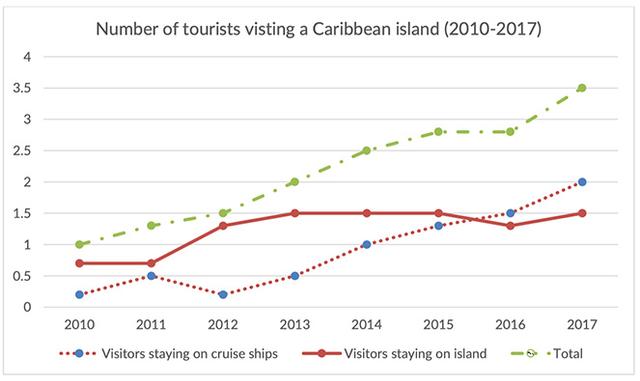
The line chart provided reveals the tourist numbers who visited a specific Caribbean
island
throughout a 7-year period of time.
Use synonyms
Overall
, as can be vividly seen from the graph, the total number of tourists visiting the Linking Words
island
climbed drastically. Use synonyms
Furthermore
, at Linking Words
first,
the number of Linking Words
visitors
staying on the Use synonyms
island
was higher than that of Use synonyms
visitors
staying on Use synonyms
cruise
Use synonyms
ships
, Use synonyms
whereas
, Linking Words
at the end
of the period shown, Linking Words
this
pattern twisted.
As illustrated by the chart, starting from nearly 750,000 Linking Words
visitors
staying on the Use synonyms
island
, Use synonyms
this
way of visiting was more popular than staying on Linking Words
cruise
Use synonyms
ships
, at approximately 250,000. Use synonyms
Afterward
, by 2015, both figures had undergone a considerable increase, with 1.5 Change the spelling
Afterwards
million
Use synonyms
visitors
staying on the Use synonyms
island
and almost 1.25 Use synonyms
million
staying on Use synonyms
cruise
Use synonyms
ships
.
Use synonyms
By contrast
, the figure for those staying on the Linking Words
island
declined by 0.5 Use synonyms
million
in the following year, being overtaken by the other cluster, before reaching 1.5 Use synonyms
million
again in 2017. The figure for staying on Use synonyms
cruise
Use synonyms
ships
, Use synonyms
however
, continued its onward march to 2 Linking Words
million
in 2017.Use synonyms