
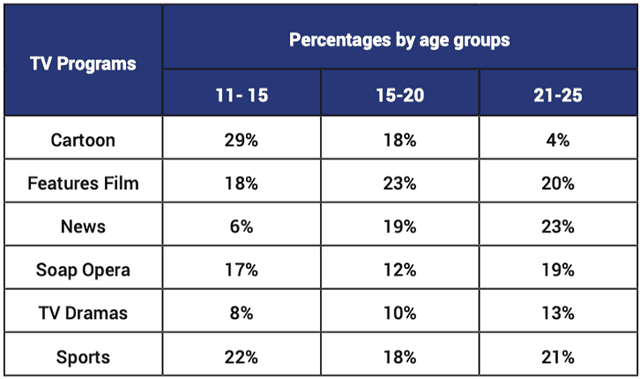
Overall
, the table illustrates the proportion of Linking Words
age
groups in children, teenage and adults, and which programs they watched in Europe in 2012
Use synonyms
Firstly
, cartoons was seems to be a popular tv show among the ages of 11 to 15, which was watched by 29% of kids Linking Words
whereas
18% in the ages 16 to 20 and significantly low at 4% from 21 to 25. Linking Words
However
films, soap opera and sports program were considerably watched Linking Words
similarly
by these three Linking Words
age
groups with an average rate of 18 to 20%, but soap opera was less interesting among teenagers at only 12% .
In terms of news programs, the Use synonyms
age
group of 11 to 15 for significantly found bored, Use synonyms
therefore
, it was watched by 6%, but 19% and 23% of the Linking Words
age
group 16 to 20 and 21 to 25 enjoyed watching it. At the Use synonyms
last
TV dramas were preferred by an around average percentage of 10% in a given Linking Words
age
group.Use synonyms