
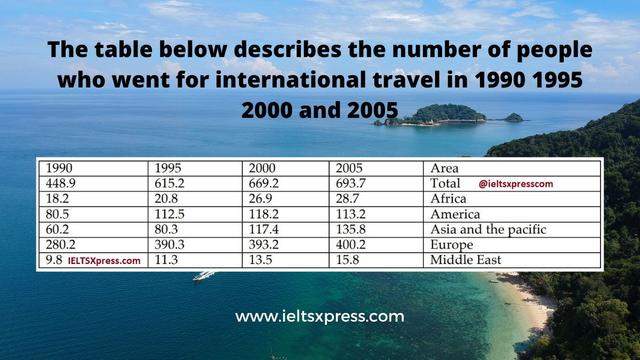
the provided table depicts information on the number of tourists in
million
that visited some continents; in the period of 15 Use synonyms
years
for 4 different Use synonyms
years
from 1990 to 2005.
Use synonyms
overall
, it clearly can be seen that Europe has the biggest amount of overseas visitors over the given duration whilst the Middle East has the lowest total of them.
Linking Words
To begin
with, tourism in Africa had witnessed a slight increase over the Linking Words
years
with about 18, 21,27,29 Use synonyms
million
in 1990,1995,2000 and 2005, respectively. Use synonyms
In contrast
, Asia and the Pacific had approximately 60 in 1990, Linking Words
then
it jumped by 20 to nearly 80 in 1995. The figure of Asia visitors kept increasing until 117 in 2000, five Linking Words
years
later, it became 136 Use synonyms
million
. America's tourists as well continued to grow in number, from 80 Use synonyms
million
in 1990 to 113 in 2005. Use synonyms
On the other hand
, the Erupre continent was an attractive destination for overseas visitors since 1990, with around 280 tourists. In 1995, the number rose by 110 Linking Words
million
to 390, Use synonyms
however
, Linking Words
this
growth almost stabilized in 2000 to reach only 393. Within five Linking Words
years
, Europe international travellers accessed 400, which was considered the highest sum of all.Use synonyms