
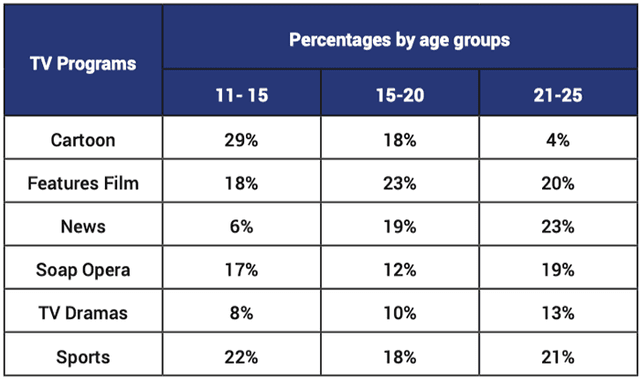
The table illustrates the rates of
TV
programs preferred by the three different Use synonyms
age
groups(11-15, 15-20, 21-25) in a European country in the year 2012. Use synonyms
Overall
, the 11 to 15 years old Linking Words
group
preferred to watch cartoons the most, Use synonyms
while
teenagers between 15 to 20 watched feature Linking Words
films
Use synonyms
instead
. On the other side, the news was the most popular option for adults who are between 21 to 25.
The youngest Linking Words
age
Use synonyms
group
had the highest rate of 29% for watching cartoons, which is followed by sports with a percentage of 22. Features Use synonyms
films
and soap operas had a very similar preference rate Use synonyms
that is
18% and 17% respectively, on the other ,hand news is the least popular Linking Words
TV
program to watch among Use synonyms
this
Linking Words
group
(6%).
As the Use synonyms
age
increases, the distribution of interest in different kinds of Use synonyms
TV
shows became more balanced, Use synonyms
according to
the gap between the highest rate of 23%(Feature Linking Words
films
) and the lowest percentage of 10(Use synonyms
TV
dramas).
The oldest Use synonyms
age
Use synonyms
group
which comprises 21 to 25 years old adults are more eager to watch news, sports and feature Use synonyms
films
than other Use synonyms
TV
programs, Use synonyms
,
Change the punctuation
apply
Linking Words
furthermore
these three shows had very similar proportions which are around one-fifth each.Add a comma
,furthermore