
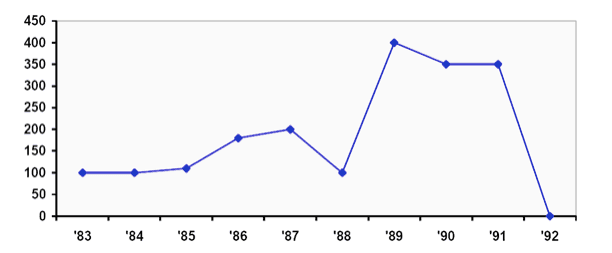
The line graph provides information on the
number
of diarrhoea Use synonyms
cases
in the city of Mashhad from 1983 to 1992.
Use synonyms
Overall
, the Linking Words
number
of Use synonyms
cases
fluctuated in Use synonyms
this
period reaching the highest point in 1989 and later plummeting to register zero Linking Words
cases
of patients in 1992.
Starting off with a little over 100 Use synonyms
cases
in 1983, the Use synonyms
number
of diarrhoea Use synonyms
cases
climbed consistently over the period of half a decade to hit 200 in 1987. Use synonyms
Then
, a steep decrease was registered for a year sitting at approximately 100 in 1988 meaning that it was returned to the previous rate. The highest increase was experienced a year later when patients of Linking Words
this
disease quadrupled to roughly 400 in early 1989. Linking Words
Subsequently
in the next two years, the Linking Words
number
of patients hovered around 400 and 350 Use synonyms
cases
. Use synonyms
Finally
, in late 1991 figures undertook a precipitous cut in patient rates reaching zero Linking Words
cases
in the middle of 1992.Use synonyms