
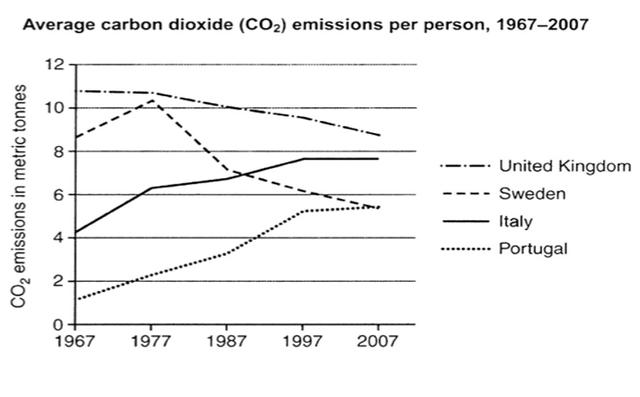
The graph illustrates the five countries' populations in emissions of
carbon
dioxide between 1967 and 2007.
Use synonyms
Overall
, it can be seen that Linking Words
carbon
footprints come from the United Kingdom, Sweden, Italy, and Portugal. Use synonyms
Moreover
, the UK has the most soot emissions, Linking Words
as well as
, Italy has an increased fluctuation.
Linking Words
To begin
with, the UK has 11 metric tonnes of co2 released into the atmosphere and it has a plummeting variation during the era. Linking Words
Furthermore
, Sweden is the second country to release co2 into the air in 1967. Linking Words
In addition
, Sweden had a fall during the period and it is the nation which emits Linking Words
carbon
footprints lower in 2007.
Use synonyms
On the other hand
, Italy had a rise in variation in emitting co2 in the atmosphere. Linking Words
However
, it had a gradual increase during the period, Linking Words
as well as
Linking Words
,
it reached a peak during 2007. Remove the comma
apply
Along with
it, Portugal Linking Words
also
had a rise in variation in emitting co2 footprints in the environment. Linking Words
However
, it begins with Linking Words
a
2 per cent of the emission of Correct article usage
apply
carbon
into the sky. Use synonyms
Moreover
, it gradually rise and reached a peak in 2007.Linking Words