
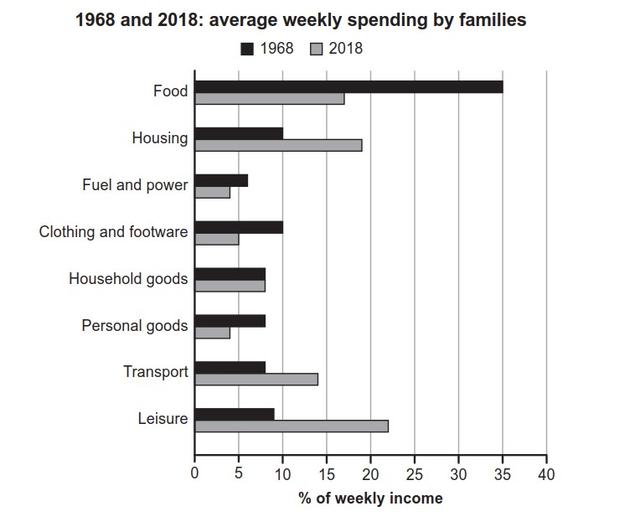
The bar chart illustrates the information about the weekly spending by the people of each country on various 8 different items in 1968 and 2018.
However
,calculations had been mentioned in percentage (%).
Linking Words
Overall
Linking Words
it is clear that
the spending on Food,Fuel,Clothing and Personal Linking Words
goods
has declined over fifty years Use synonyms
while
household Linking Words
goods
expenses remained the same.Use synonyms
However
, Transport and Leisure's figures have increased over time.
In terms of spending money on Food percentages have declined much approximately became halved in 2018 from 30% to about 15% in comparison with Housing rents which have increased around about 10% over 50 years Linking Words
while
Clothing and Personal Linking Words
goods
both reduced much by half decade from 10% to 5% and from about 8% to 4% respectively.
Use synonyms
On the other hand
, Household Linking Words
goods
have been remaining the same since 1968 (about 7%) Use synonyms
whereas
Transport has a sharp increase of approximately 8% and Leisure spending is the only item Linking Words
that is
increased dramatically more than double from around about 8% to 22%.Linking Words