
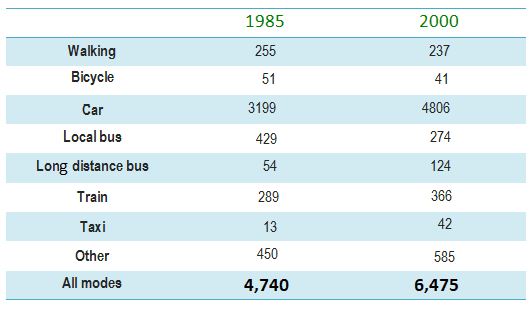
The following table compares eight different types of transportation models among people in England in fifteen years time from 1985 to 2000.
Looking from an
overall
perspective, it is readily apparent that the most noteworthy change was the car, followed by other Linking Words
as well as
local bus and even train, Linking Words
while
the least and smallest mile in the graph was the taxi.
In 1985, the total mile of a car was 3199, and Linking Words
this
figure peaked at 4806 which was the highest number in the data. As for the local bus, it was at 429 in the first year and Linking Words
then
significantly decreased to 274. Linking Words
Likewise
, walking and train, which showed broadly similar trends, average miles were 289 and 255 respectively. Linking Words
Next,
the long-distance bus was higher than bicycle ones by 3 miles.
Linking Words
On the other hand
, other transportation methods considerably rose from 450 to 585 in the final year surveyed. Linking Words
In addition
, the taxi, which was only 13 miles in 1985, dramatically went up to 42 in the Linking Words
last
year of the period.Linking Words