
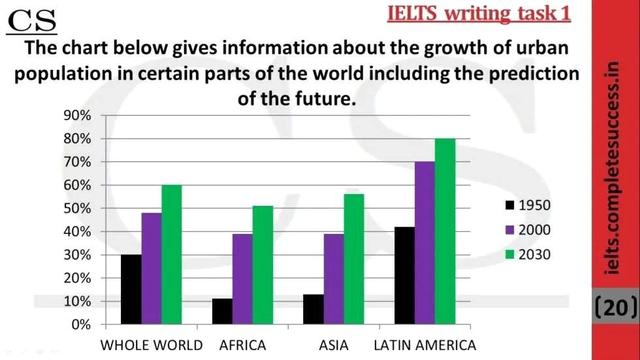
The bar chart illustrates data about the world's future prediction of the
growth
of the urban population between 1950 and 2030.
Use synonyms
Overall
, it can be seen that there are fluctuations during the era. The Whole World, Africa, Asia and Latin America had an upward trend during the period.
Linking Words
To begin
with, Whole World has rise variation during the period. Linking Words
Moreover
, during 1950 it had Linking Words
30
per Correct article usage
a 30
cent
of Use synonyms
growth
in urbanisation and is expected 60 per Use synonyms
cent
of the population in 2030. Use synonyms
In addition
, Africa has the least Linking Words
growth
in city individuals during 1950 but managed to rise by 60 per Use synonyms
cent
by 2030.
Use synonyms
On the other hand
, Asia Linking Words
also
has less Linking Words
growth
of people in 1950 with 12%, but managed and rises 40 per Use synonyms
cent
in 2000, Use synonyms
as well as
, it is expected to raise top in 2030. Linking Words
However
, Latin America has Linking Words
an
increasing trend since 1950 and is expected to reach a peak during 2030. Add a missing verb
had an
Furthermore
, it had 65 per Linking Words
cent
of urban people Use synonyms
growth
during 2000.Use synonyms