
THE provided
pie
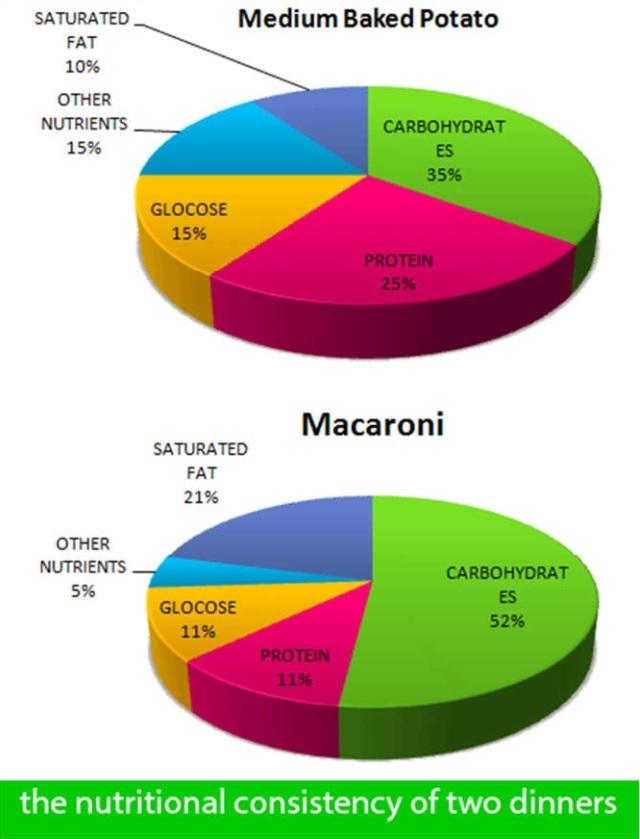
charts give data relating to the five different nutrients in the consistency of two various meals, namely Use synonyms
medium
baked Use synonyms
potato
and Use synonyms
macaroni
.
From an Use synonyms
overall
perspective, it can be seen that carbohydrates take the majority Linking Words
proportion
of nutritional consistency.
Looking at the Use synonyms
pie
chart meticulously, it can be inferred that carbohydrates are less in the Use synonyms
medium
baked Use synonyms
potato
which depicts 35%, whilst Use synonyms
macaroni
consists of 52% of carbohydrates. Use synonyms
Furthermore
, saturated fat in baked potatoes represents double the Linking Words
proportion
of the Use synonyms
macaroni
, which accounted for 10% and 21% respectively.
From the given statistics, it is obvious that Use synonyms
macaroni
contains 11% , Use synonyms
while
Linking Words
medium
baked Use synonyms
potato
represents 25% of protein, which is about one-fourth of the Use synonyms
pie
chart. Use synonyms
In contrast
, the Linking Words
proportion
of glucose remains stable in both Use synonyms
macaroni
and Use synonyms
medium
baked Use synonyms
potato
, showing 11% and 15% respectively. Other nutrients in baked potatoes display third times low in Use synonyms
proportion
, which figures 5% in the Use synonyms
pie
chart.Use synonyms