
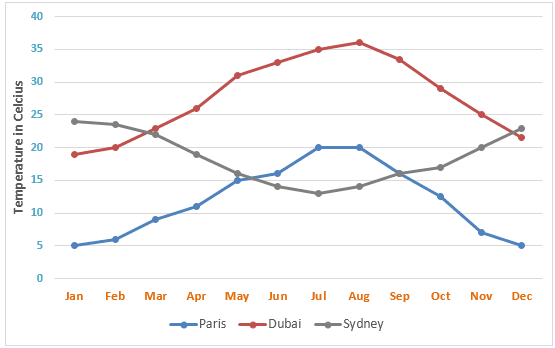
The line graph illustrates changes in average
temperatures
in a month in three different cities: Use synonyms
Paris
, Use synonyms
Dubai
and Use synonyms
Sydney
. The Use synonyms
temperature
is displayed in Celsius Use synonyms
degrees
.
Use synonyms
According to
the graphic presentation, the weather report in Linking Words
Sydney
is not the same as in Use synonyms
Dubai
and Use synonyms
Paris
. Use synonyms
Moreover
, Linking Words
Paris
is the coldest city compared to Use synonyms
Dubai
and Use synonyms
Sydney
.
To start with, the Use synonyms
temperature
range in Use synonyms
Paris
never rises beyond 20 Use synonyms
degrees
. Use synonyms
Whereas
the Linking Words
temperature
range in Use synonyms
Dubai
hardly reduced from its average level, except during January (19 Use synonyms
degrees
C). Use synonyms
Nevertheless
, the Linking Words
temperatures
in Use synonyms
Paris
and Use synonyms
Dubai
still have some commonalities, as their Use synonyms
temperatures
rise gradually at the beginning of the year and reach the maximum of 20 and 36 respectively in August. Later, both Use synonyms
temperatures
will reduce sharply.
When it comes to Use synonyms
Sydney
, the place experiences a 24-degree Use synonyms
temperature
in January. Use synonyms
Then
immediately after that, the Linking Words
temperature
drops to the lowest point of 14 Use synonyms
degrees
in July. Use synonyms
Similarly
, Linking Words
at the end
of the year, the Linking Words
temperature
shoots up to 23 Use synonyms
degrees
.Use synonyms