
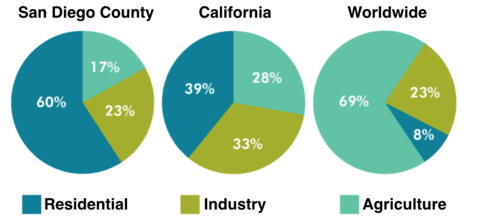
The pie charts give information about the
water
used for residential, industrial and agricultural purposes in Use synonyms
San
Use synonyms
Diego
County, Use synonyms
California
and the world as a whole.
It is noticeable that more Use synonyms
water
is consumed by homes than by industry or agriculture in the two American regions. Use synonyms
By contrast
, agriculture accounts for the vast majority of the Linking Words
water
used worldwide.
In Use synonyms
San
Use synonyms
Diego
County and Use synonyms
California
State, residential Use synonyms
water
consumption accounts for 60% and 39% of total Use synonyms
water
usage. Use synonyms
However
, a mere 8% of the Linking Words
water
used globally goes to homes. The opposite trend can be seen when we look at Use synonyms
water
consumption for agriculture. Use synonyms
This
accounts for a massive 69% of global Linking Words
water
use, but only 17% and 28% of Use synonyms
water
usage in Use synonyms
San
Use synonyms
Diego
and Use synonyms
California
respectively.
Use synonyms
Such
dramatic differences are not seen when we compare the figures for industrial Linking Words
water
use. The same proportion of Use synonyms
water
(23%) is used by industry in Use synonyms
San
Use synonyms
Diego
and worldwide, Use synonyms
while
the figure for Linking Words
California
is 10% higher, at 33%.Use synonyms